
Digital Evaluation Technology for Material Microstructures
August 2026
Core Technology R&D Center
Technology Development Division Headquarters
1. Introduction
Rolling bearings (hereinafter referred to as "bearings") are critical components that support rotation in automobiles and industrial machinery, and their service life directly affects the overall reliability of the product. Because bearings are subjected to extremely high, repetitive contact pressure, fatigue damage called flaking occurs, in which the bearing surface peels away in a scale-like pattern (Fig.1). Bearing life is defined as the time elapsed until flaking occurs.
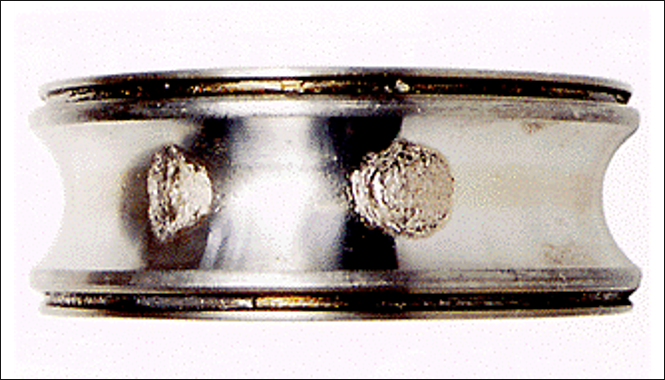
Fig.1 Appearance of flaking on a bearing inner ring1)
The morphology of flaking varies depending on lubrication conditions and the location where damage originates2). A representative mode is subsurface-origin flaking, which initiates from non-metallic inclusions within the steel used in the bearing. In this phenomenon, cracks initiate and propagate within the material before reaching the surface and leading to flaking. In recent years, improvements in steel cleanliness have suppressed the occurrence of subsurface-origin flaking, with some bearings exhibiting durability more than 10 times their conventional calculated rating life. Consequently, even higher precision in life prediction is required. On the other hand, under severe lubrication conditions, different damage modes become dominant. For example, surface-origin flaking, originating from indentations formed by foreign debris suspended in the lubricant, or white etching cracks, occurring under elevated hydrogen levels in the steel, can shorten service life to approximately 1/10 of calculated values. Extending service life under these harsh conditions remains a major challenge. Microstructural control through material selection and heat treatment is an effective countermeasure against these types of flaking, and NSK has developed and commercialized various long-life materials and heat treatment technologies.
As described above, NSK's materials research focuses on both predicting and preventing flaking in its R&D efforts. Because the root causes of flaking vary significantly depending on the operating environment, tailored countermeasures are necessary for each condition. To achieve this, it is essential to correctly understand individual damage mechanisms from the perspective of material microstructure, establishing experimental and analytical foundations capable of quantitatively evaluating initiation and propagation. Against this backdrop, NSK is working to advance and systematize material microstructure analysis techniques.
2. Metallic Microstructures and Conventional Evaluation Methods
Because bearings require high fatigue strength and wear resistance, high-carbon chromium bearing steel such as SUJ2 and carburized steels are used. Through heat treatment, these materials form complex metallic microstructures containing hard martensite, soft retained austenite, and carbides. Among these, the martensite phase—which constitutes the majority of the structure—is composed of a hierarchical structure known as packet and block structures, which are known to influence fatigue strength. Conventionally, microstructural observation via chemical etching has been used to capture these structural characteristics. Fig.2 shows the microstructural observation results of SUJ2 bearing steel using an optical microscope (a) and a scanning electron microscope (SEM) (b). In Fig.2(a), chemical etching selectively highlights portions of the microstructure, allowing visual observation of the distribution and morphology of crystal grain boundaries (prior austenite grain boundaries) and spherical carbides. In Fig.2(b), the martensite block structure and spherical carbides can be identified. However, in optical microscopy (Fig.2(a)) and electron microscopy (Fig.2(b)), the internal martensitic microstructure is not always clear, making it difficult to quantitatively distinguish structural units solely from observed images.
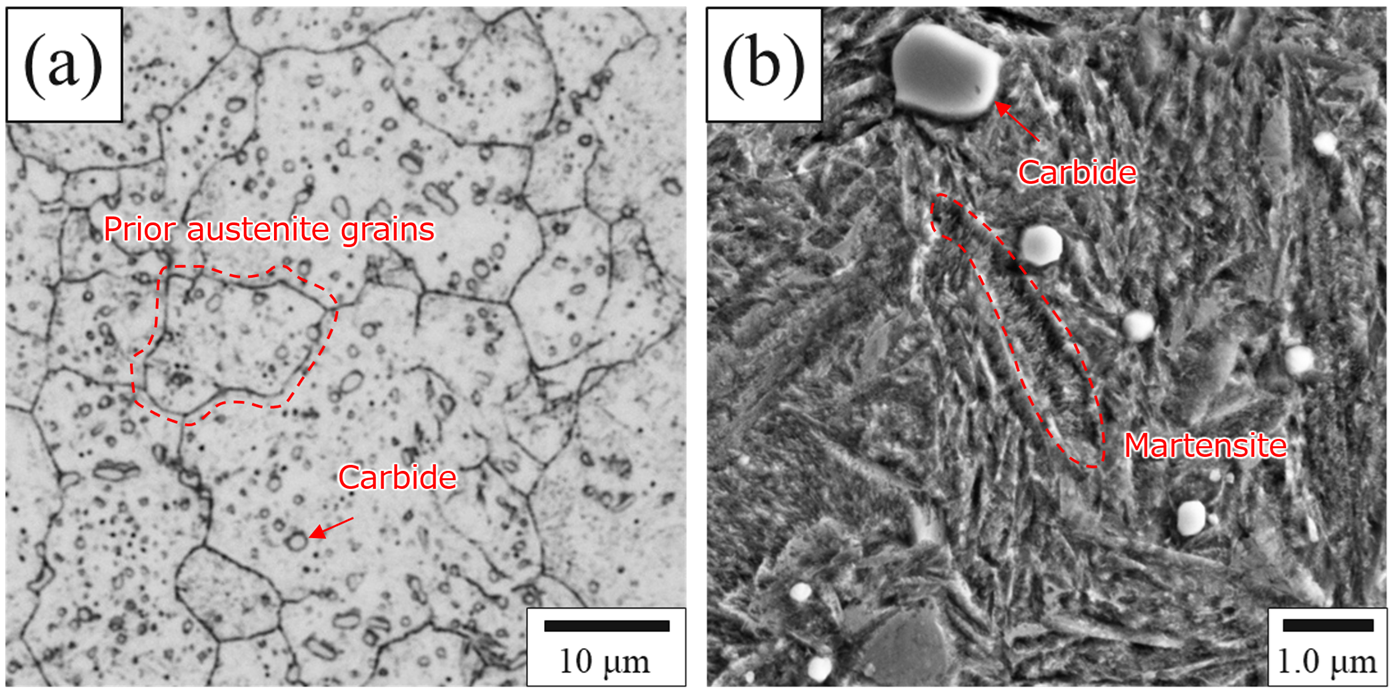
Fig.2 Examples of microstructural observation of bearing steel
(a) Optical micrograph, (b) Scanning electron micrograph
3. Challenges in Bearing Steel Microstructure Analysis and Efforts Toward Further Advancement
In recent years, advances in electron backscatter diffraction (EBSD) have enabled high-precision acquisition of more detailed information within metallic microstructures. Fig.3 shows the analysis results of SUJ2 bearing steel obtained by EBSD. This figure, called a crystal orientation map, visualizes and evaluates crystal grains inside the microstructure that were difficult to distinguish using conventional methods. Each colored region in Fig.3 represents an individual martensite grain. For example, within the prior austenite grain boundary outlined by the white dashed line, multiple fine martensite crystal grains are present. These fine crystal grains contribute to the high strength of bearing steel.
While grain size is a useful indicator that correlates with average material strength, the importance of local properties of individual crystal grains has been emphasized in recent years. Particularly in martensitic structures, individual crystals exhibit preferential deformation directions3) and deviatoric residual stresses4), creating direction-dependent mechanical properties (anisotropy). This anisotropy causes localized strength variations, which can lead to unexpected premature failure even in identical materials. Therefore, to evaluate material strength with high accuracy, it is crucial to understand this anisotropy in addition to grain size representing average properties.
Martensitic microstructures can be classified into subdivisions called variants. Each variant possesses a distinct crystal orientation and a different preferential slip deformation direction. Consequently, even martensite formed within the same prior austenite grain exhibits different deformation behavior for each variant. To fundamentally understand material strength, it is necessary to visualize these strength-influencing variants and organize them from a crystallographic perspective. However, because crystal orientations in actual materials vary widely, conventional manual variant identification presented challenges regarding ambiguous classification criteria and difficulty in applying the method to large datasets. Furthermore, because contact shear stresses act over wide areas inside bearings, variant identification must be evaluated focusing on spatial distribution rather than just isolated individual crystals. To address these challenges, this study attempts to develop a method for automatically and quantitatively classifying variants and quantitatively evaluating their spatial distribution.
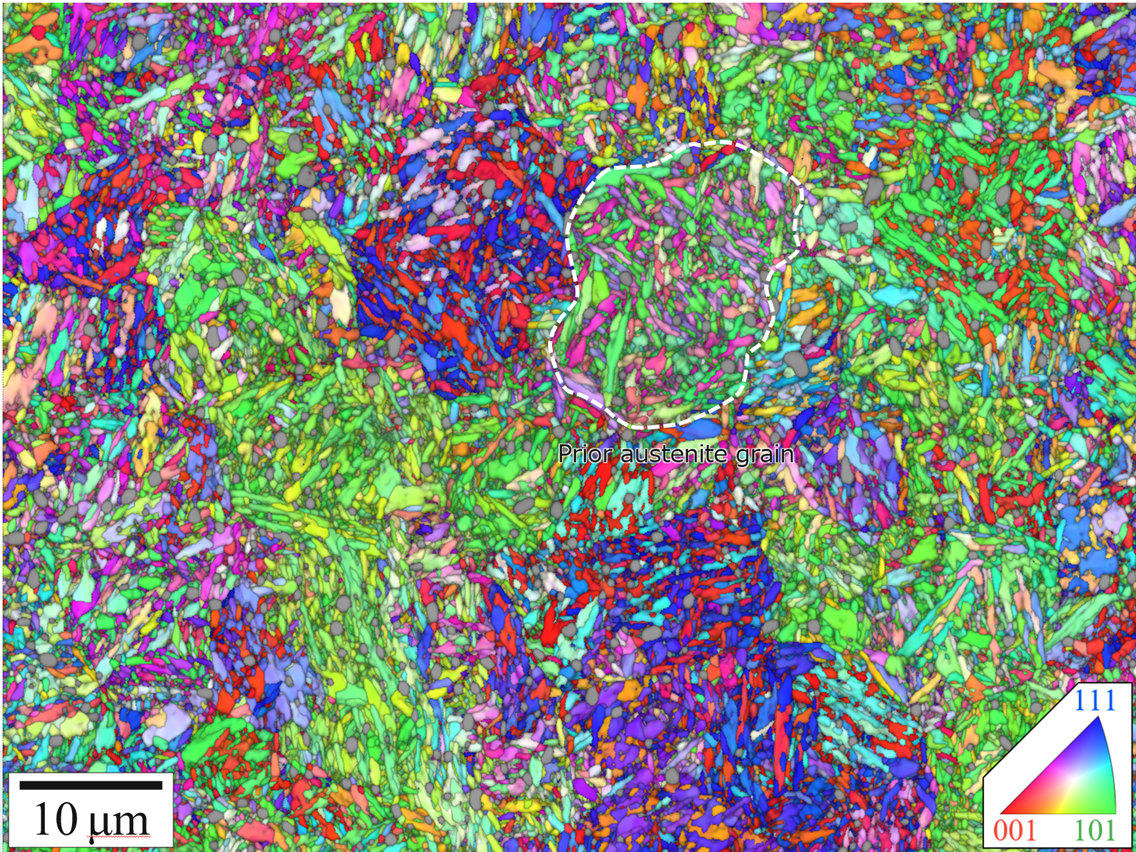
Fig.3 Crystal orientation map of bearing steel metallic microstructure
4. Variant Identification and Visualization Using Python
Crystal orientation data acquired by EBSD can reach tens of millions of data points depending on analysis conditions. Manually analyzing such large-scale data is impractical, necessitating a fast, highly reproducible computational approach. In this study, crystal orientation was interpreted as a rotation operation about an arbitrary axis and handled as a point in a three-dimensional space known as Rodrigues–Frank (R-F) rotation space. In the R-F rotation space, the magnitude of the rotation angle corresponds to distance, and the rotation axis corresponds to direction, featuring the characteristic that similar crystal orientations are positioned close to one another. This representation has high affinity with vector operations, and by utilizing Python numerical computation libraries, batch processing of tens of millions of data points becomes feasible. As a result, variant identification—which was previously complex—can be replaced with a simple geometric proximity determination problem in three-dimensional space, achieving higher analytical efficiency and improved reproducibility. Furthermore, by projecting variant information from the R-F space back into real space, regions of contiguous identical variants can be defined as blocks—the basic unit of martensitic structures—visualizing their structural distribution. The next section presents analysis results on actual material data.
5. Variant Identification in Bearing Steel Martensite
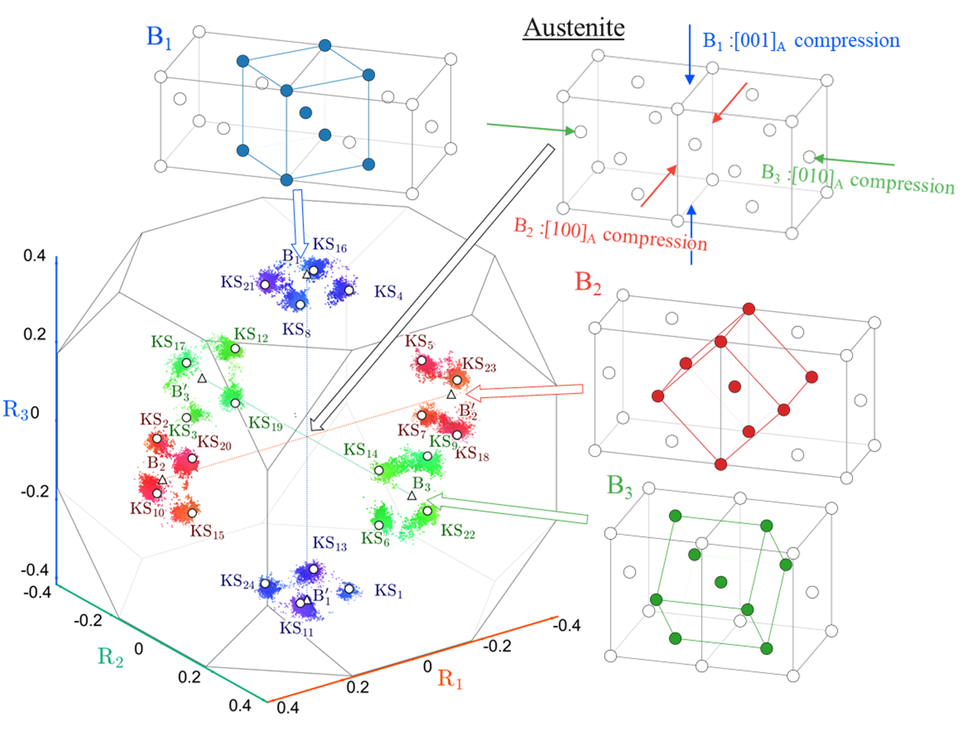
Fig.4 Orientation distribution of martensite in R-F rotation space
Fig.4 shows the crystal orientations of martensite generated within a prior austenite grain, plotted in R-F rotation space. Crystal orientation is represented as a point within a truncated hexahedron5). Analyzing crystal orientation data using R-F rotation space confirmed that martensite crystal orientations are not uniformly distributed, but rather separate into multiple distinct clusters. Fig.5 shows the results of analyzing crystal orientations on the same dataset using conventional methods. Comparing the two, the presence of clusters can be visually recognized much more clearly in R-F rotation space. Specifically, martensite crystal orientations concentrate in specific regions to form high-density clusters, with low-density regions containing fewer points in between.
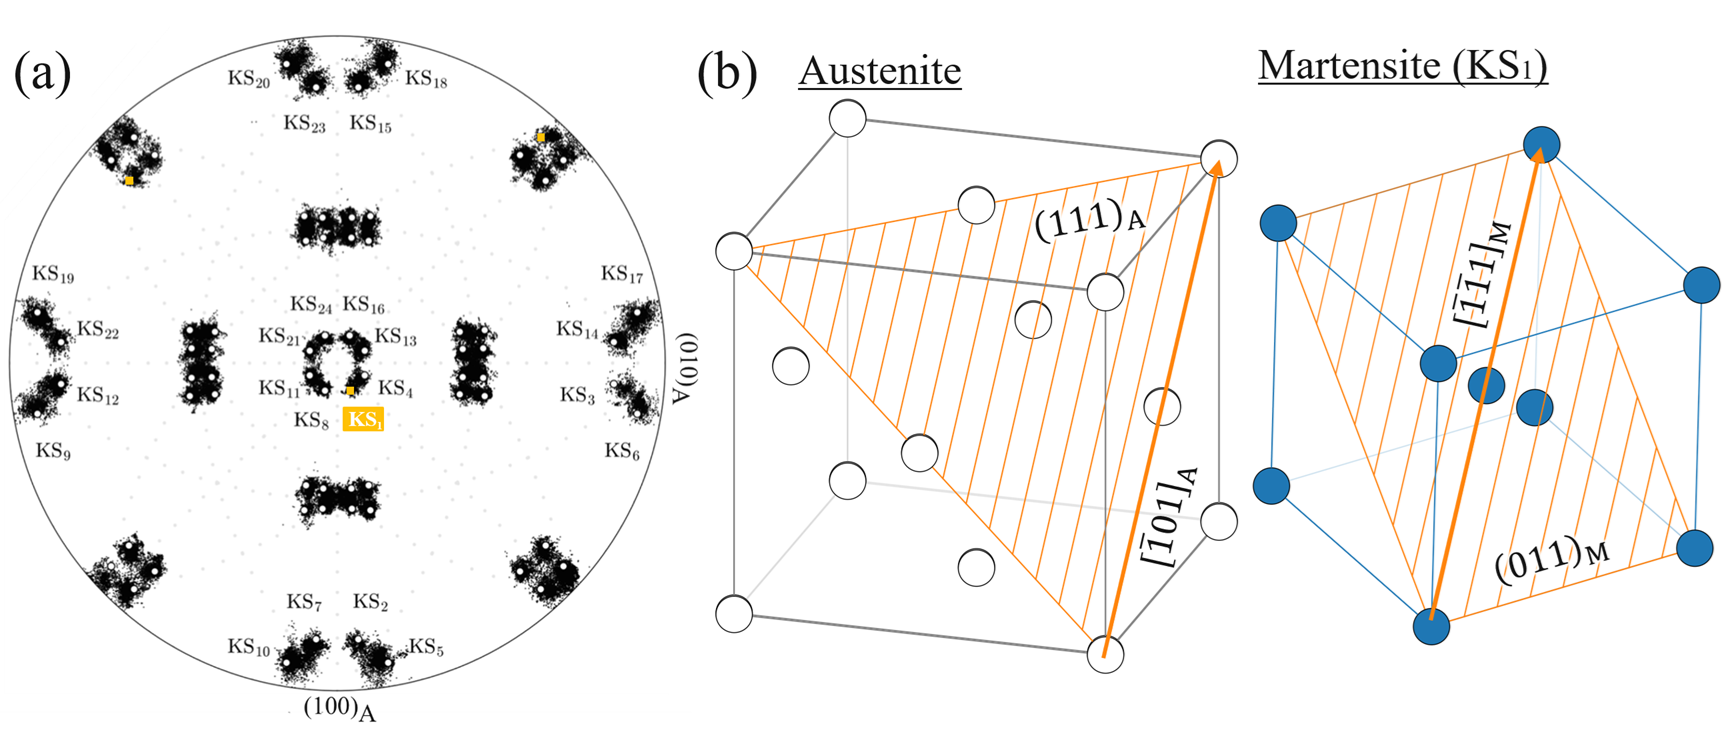
Fig.5 (a) Orientation distribution of martensite shown by pole figure and (b) an example of orientation relationship
This cluster structure can be understood more systematically by organizing it based on positional relationships in R-F space. First, crystal orientations are classified into three groups corresponding to the colors in Fig.4. These are called Bain groups (B1, B2, B3), which correspond to the lattice deformation modes during martensitic transformation. Furthermore, four clusters are observed surrounding each Bain group. These correspond to CP groups. Furthermore, each CP group forms two variants, resulting in a total classification of 3×4×2=24 variants (refer to References6) for a more rigorous classification methodology). In this way, crystal orientations can be hierarchically categorized by organizing them into Bain groups and CP groups.
By systematically classifying crystal orientations, it becomes possible to estimate grain-specific residual stress directions from the Bain groups, and preferential deformation directions from the CP groups. Utilizing these distribution characteristics in rotation space allows a variant number to be uniquely assigned to each measurement point based on its coordinates in R-F space. The next section discusses how these Bain groups and CP groups are distributed within actual microstructures.
6. Block Distribution in Bearing Steel Martensite
Fig.6 shows the results of applying variant identification based on the R-F rotation space described in Section 5 to EBSD crystal orientation data obtained from SUJ2 bearing steel. (a) is a crystal orientation map in which colors are assigned according to crystal orientation. (b) and (c) show the R-F rotation space-based variant identification results mapped back into real space. In (b), Bain groups corresponding to grain-specific residual stress directions are visualized in red, green, and blue, while in (c), CP groups corresponding to preferential deformation directions are visualized in yellow, red, green, and blue. Retained austenite and carbides are indicated in white and black, respectively, while regions where variant determination was difficult are shown in gray. Prior austenite grain boundaries are outlined with white lines.
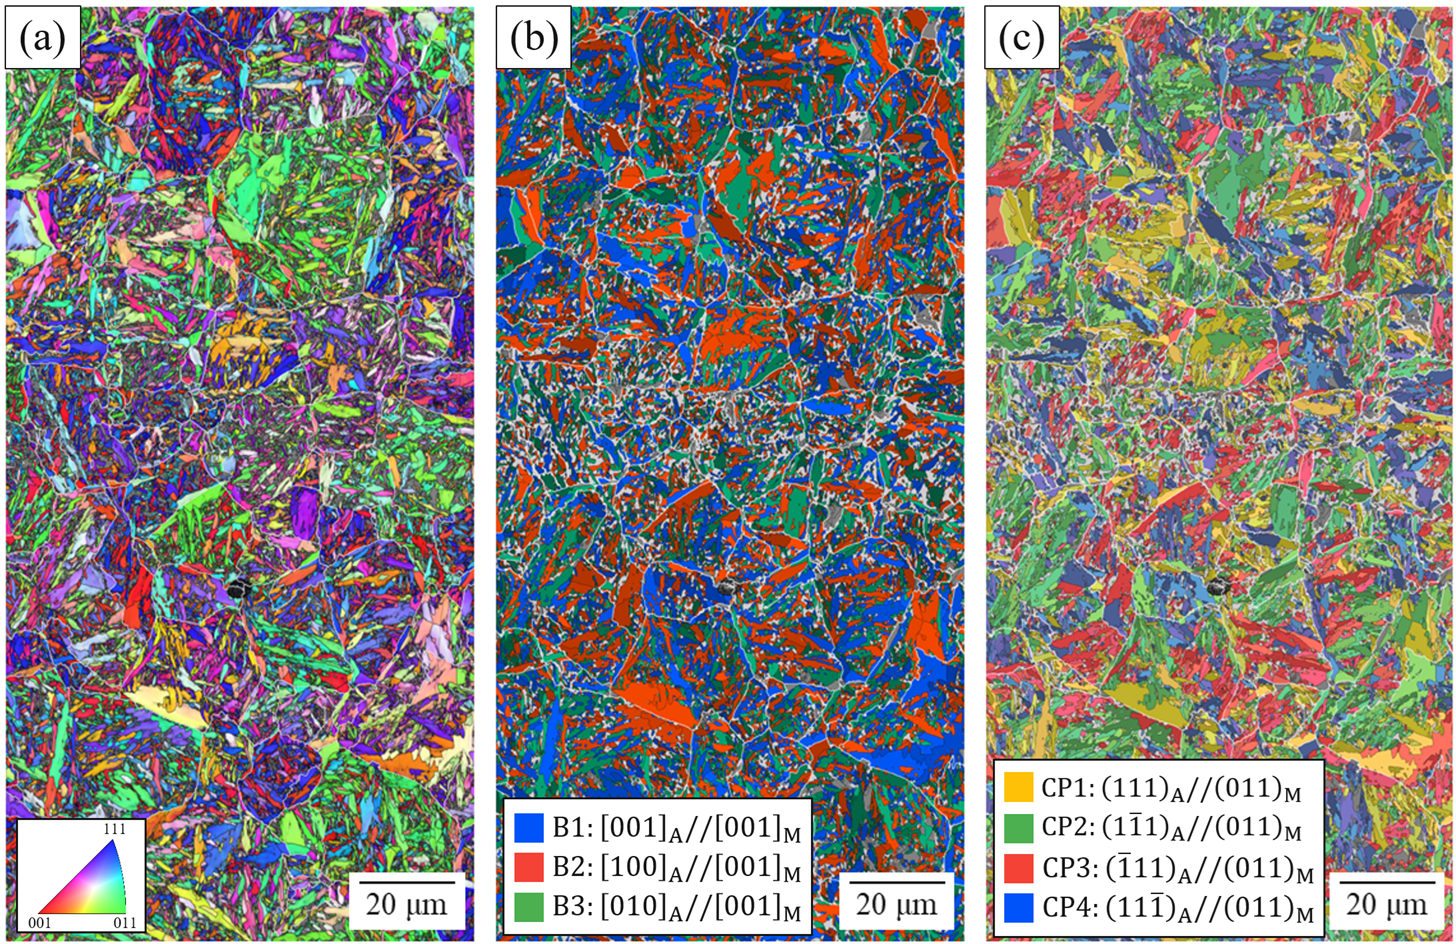
Fig.6 Results of martensite variant identification using R-F space
(a) Crystal orientation map; (b) Bain groups; (c) CP groups
In this analysis, variant identification was applied to approximately two million EBSD measurement points corresponding to martensite within the evaluation area, successfully classifying approximately 96% of the points. This result demonstrates that this method possesses high applicability and reproducibility even for large-scale crystal orientation datasets. Furthermore, this map assigns unique colors to each of the 24 variant types per measurement point. Because each block is displayed in a single color, it was confirmed that martensite in bearing steel forms blocks consisting of a single variant type. This trend differs from low-carbon steels, where blocks are composed of two variant types7). Looking at the distribution of Bain groups within crystal grains, all three groups exist in roughly equal proportions, exhibiting a complex, intricate arrangement. On the other hand, focusing on the distribution of CP groups revealed a tendency for variants belonging to the same group to exist contiguously in space. This suggests that easy-deformation directions are locally aligned, implying a relationship with deformation behavior and crack initiation sites under applied stress.
These results show that projecting R-F rotation space-based variant identification back into real space enables the visualization of Bain groups corresponding to grain-specific residual stress directions and CP groups corresponding to preferential deformation directions. Visualizing microstructures based on crystallographic information brings us closer to understanding the anisotropy responsible for variations in material strength.
7. Summary
In this article, we focused on variant anisotropy—an aspect increasingly emphasized in recent years—alongside traditional grain size metrics as a key material property influencing bearing flaking life.
To quantitatively evaluate anisotropy, we proposed an automated variant identification method using R-F rotation space, enabling crystallographic classification and distribution evaluation for large-scale crystal orientation data. Furthermore, by applying this method to actual bearing steel, we demonstrated that spatial distributions of variants and their corresponding residual stress directions and easy-deformation directions—factors impacting material strength—can be effectively visualized.
This method provides a new means to quantitatively evaluate martensitic microstructural anisotropy, which was previously difficult to achieve. It is expected to contribute to a deeper understanding of bearing damage mechanisms and improve the accuracy of life predictions. Through these efforts, NSK will continue to achieve even higher reliability and longer service life for bearings, contributing to a safe, secure society and the realization of carbon neutrality.
References
1) Bearing Doctor (Bearing Damage and Countermeasures), NSK Website: https://www.nsk.com/content/dam/nsk/common/catalogs/ctrgPdf/bearings/e7005c.pdf
2) N. Mitamura, "Rolling Bearing Fatigue and Its Research Trends," Journal of Japan Society of Tribologists, 53-10 (2008), 641–646.
3) Y. Mine et al., "Micro-tension behaviour of lath martensite structures of carbon steel," Materials Science & Engineering A, 560 (2013) 535–544.
4) D. Fukui et al., "Internal residual stress originated from Bain strain and its effect on hardness in Fe–Ni martensite," Acta Materialia, 196 (2020) 660–668.
5) Y. He et al., "Representation of misorientations in Rodrigues-Frank space: Application to the Bain, Kurdjumov-Sachs, Nishiyama-Wassermann and Pitsch orientation relationships in the Gibeon meteorite," Acta Materialia, 53 (2005) 1179–1190.
6) K. Tamura et al., "Microstructural Characterization of Martensite Formed in High-carbon Steel Based on Rodrigues-Frank Space," ISIJ International, 64 (2024) 218–225: https://doi.org/10.2355/isijinternational.ISIJINT-2023-211
7) S. Morito et al., "The morphology and crystallography of lath martensite in Fe-C alloys," Acta Materialia, 51 (2003) 1789–1799.